
1
2
3
4
5
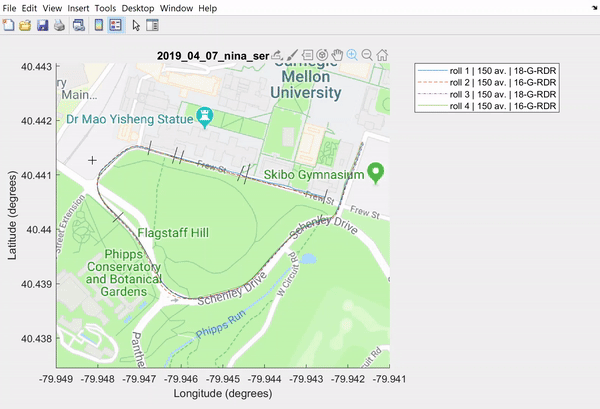
GPS data of a buggy rolling around the course
This is an example MATLAB output of a driver rolling around the buggy course. It gives speed, latitude, and longitude, as well as plotting it on top of a Google Map. The distances put on the wheels during each roll around the course are added to a separate wheel database that is updated every time the code is executed.
This was a project that I started at Spirit, and it allows us to compare driver lines, different wheel types, and inform our choice of pushers.
Satellite view of course and driver trajectory
This is the MATLAB output of the GPS data plotted on a satellite map. This is the same as the plot in the video, only with a satellite background. It uses a Google Maps Static API call to plot the map behind the GPS data, which is reformatted to WGS84 coordinates.
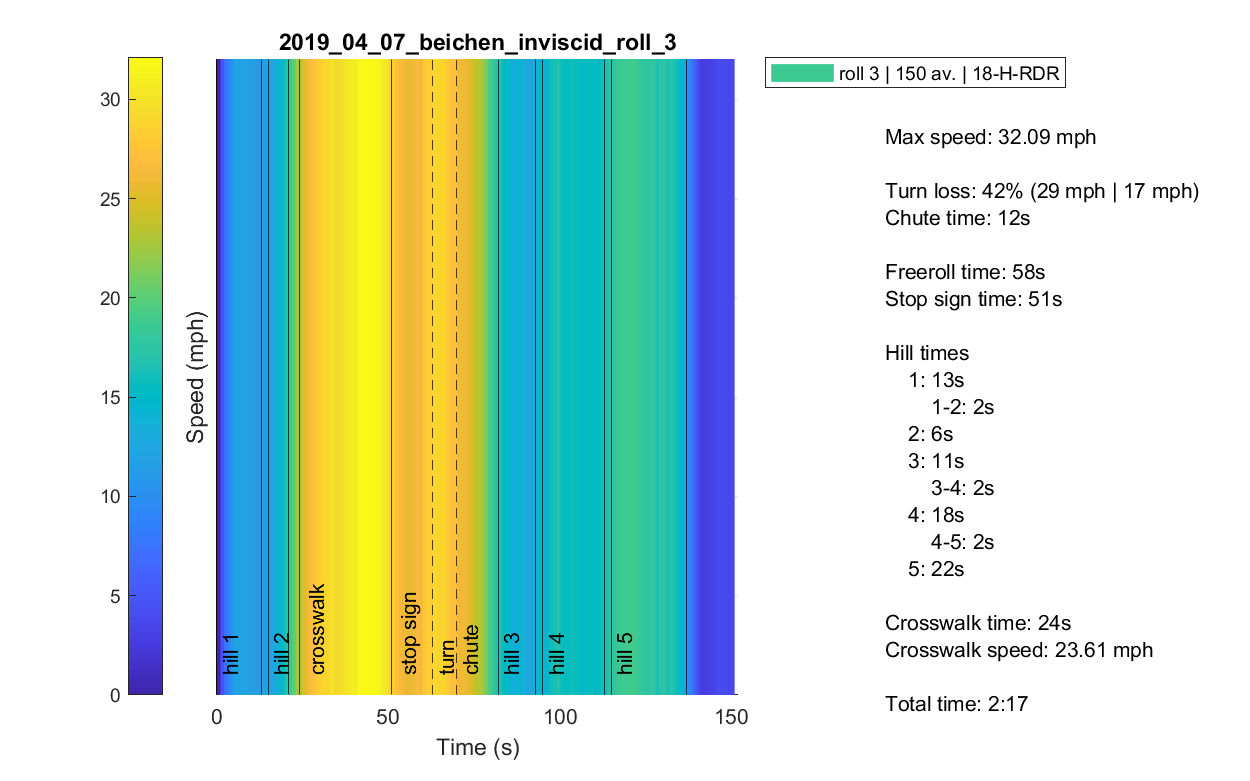
Gradient of driver speed and basic analytics
Along with the MATLAB output above, the program outputs a gradient of the driver’s speed throughout the course. It also gives max speed and hill 2 pushoff speed, and various times of interest (such as the freeroll times, hill times, etc.). The freeroll times are used to test the properties of different wheels and heating techniques, while the chute loss is used for testing out and comparing different driver lines. The hill times are used for pusher selection.
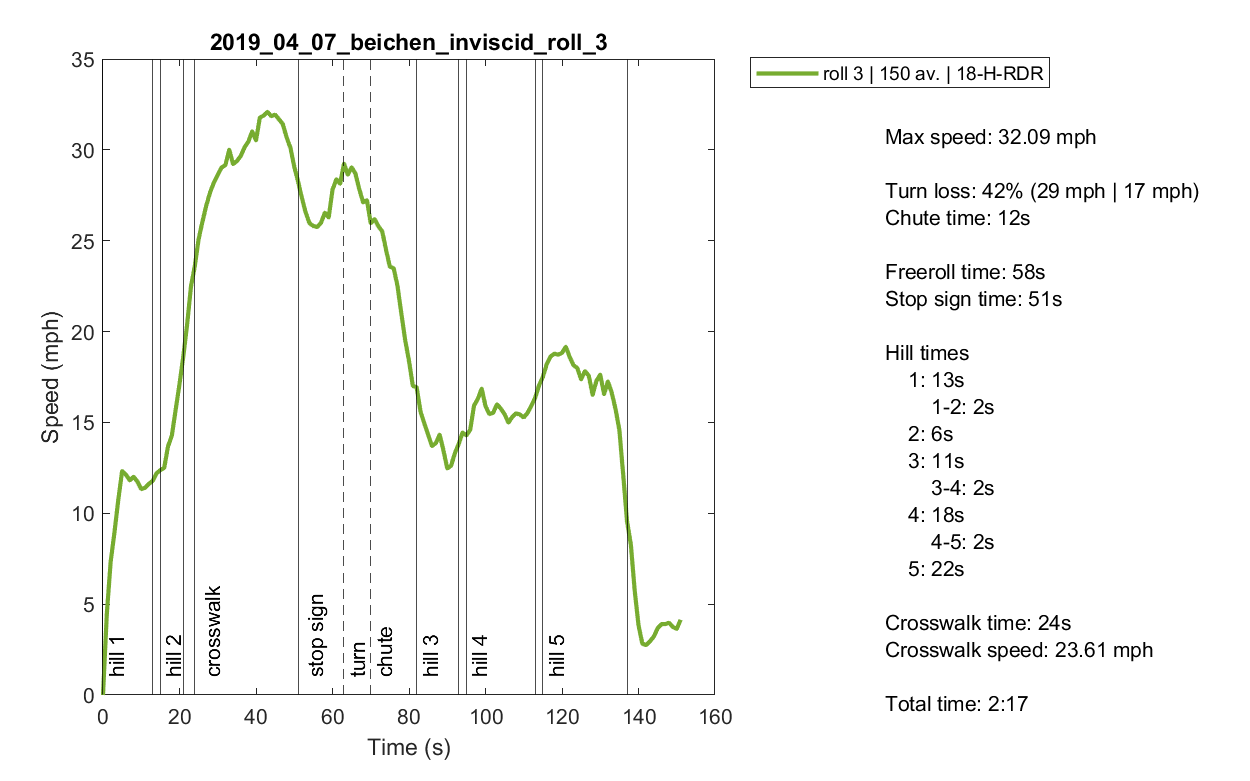
Speed-time plot
This outputs the same information as the gradient plot. In addition to the other information, the plot contains the location in the roll where certain markers occur (such as the hill transitions), allowing for easy viewing of where speed gains and losses occur.
A pusher database is automatically updated that assigns the hill times from each roll to the pushers. This is used in selecting pushers for raceday.
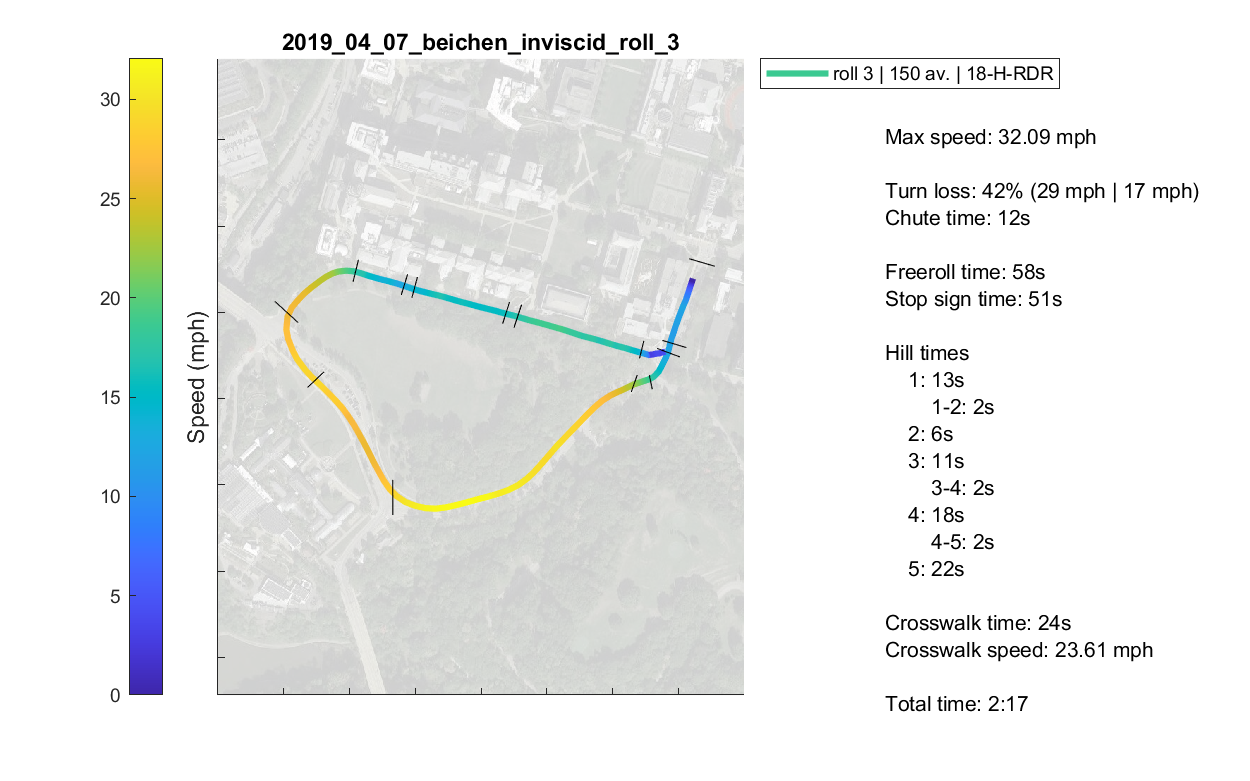
Gradient-Line Plot
Combining the best of both worlds, the gradient-line plot shows the overhead view of the driver’s roll on a Google Maps satellite map. The path is colored based on the smoothed speed data from the roll. The points of interest are drawn as lines along the course.